'%3e%3c/path%3e%3c/svg%3e)
From raw responses to decisions, dramatically faster.
Live dashboards, crosstabs, and an AI analyst grounded in your real respondent data. Explore, segment, and report without ever leaving the workspace.
Every response, the moment it lands.
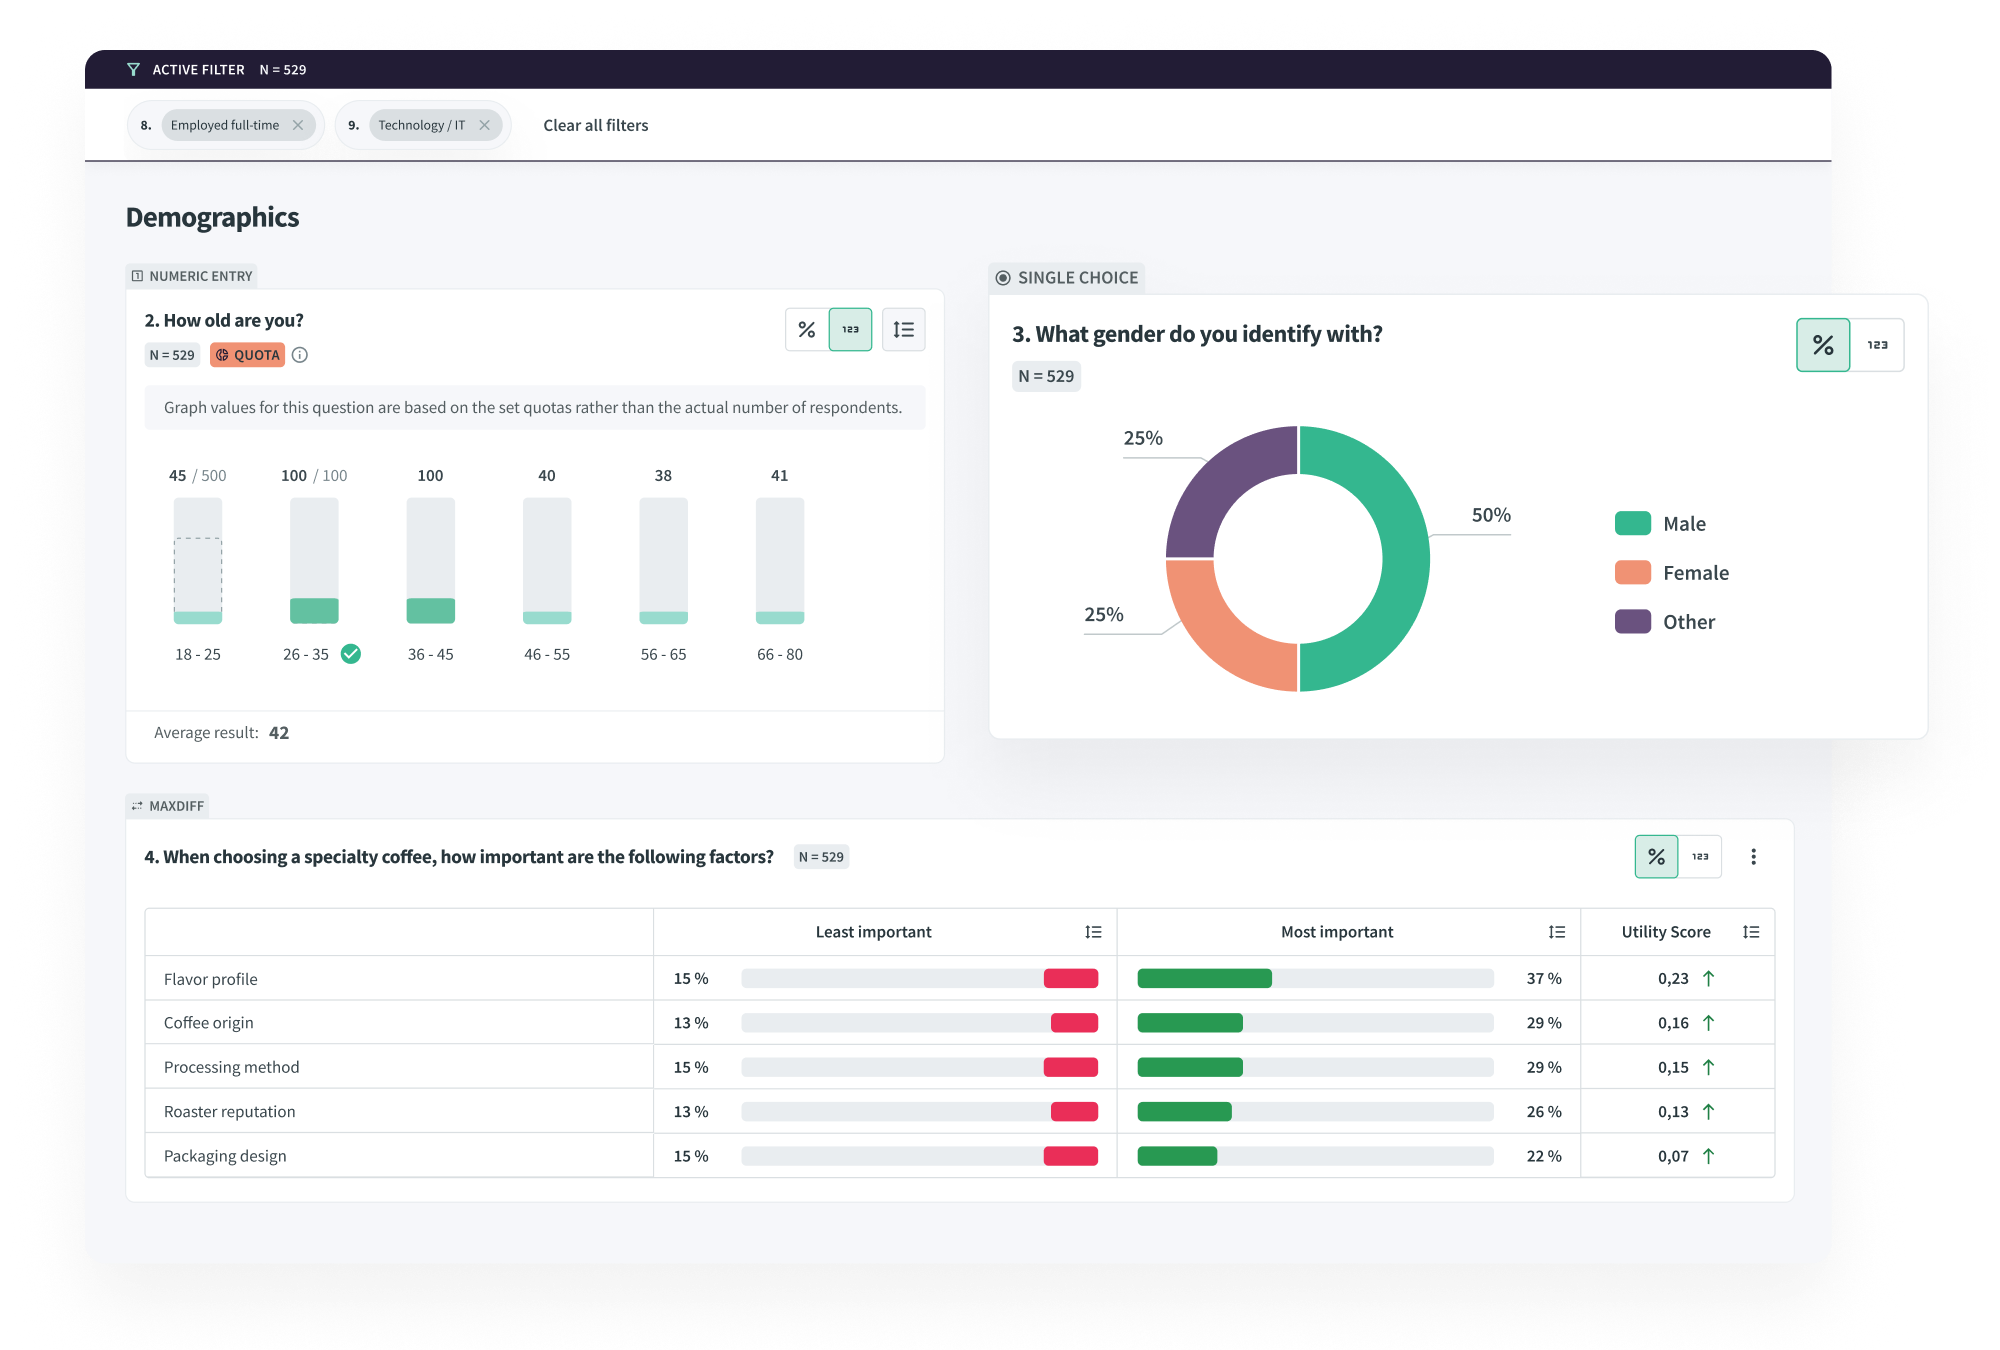
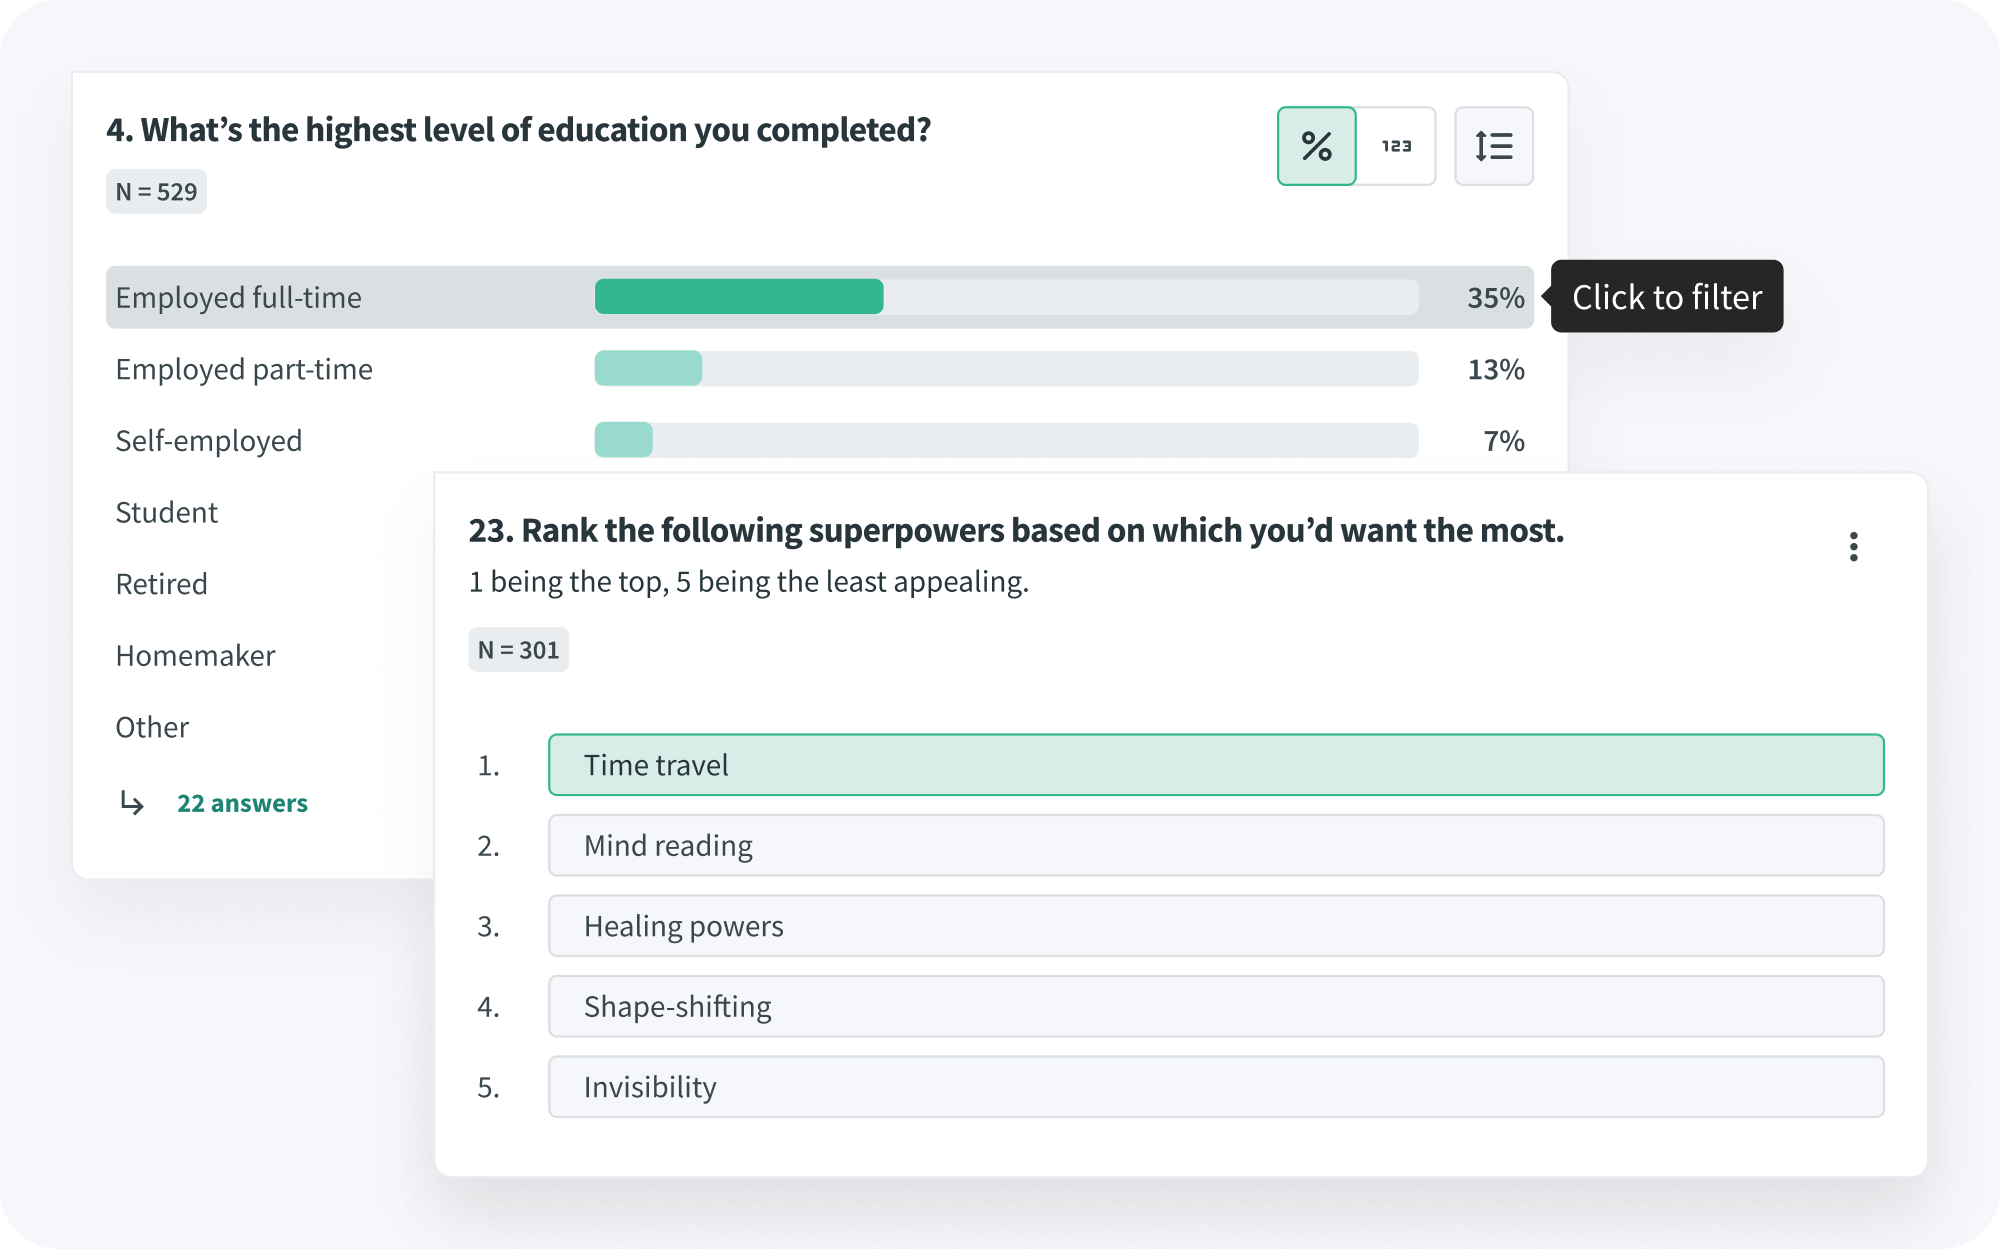
Survey and interview data streams into a single dashboard. Filter, segment, and explore in real time — open ends are auto-coded, AI interviews are summarised, and respondent counts update as fieldwork continues.
Each question becomes its own slide. Charts and tables stay fully editable in PowerPoint.
Patterns become obvious.
Cross-reference any variables, side by side. Cells are tinted by frequency and significance so meaningful differences surface before you start looking for them.
- Drag-and-drop rows, columns and answer sets
- Heatmap intensity highlights significant cells
- Filter by any segment without rebuilding the table
- Export to Excel with one click
An intelligent analyst, sitting on top of your data.
Ask in natural language. Compare audiences, surface themes, generate tables, extract quotes. Every answer is grounded in real respondent data — and every finding links back to the source responses it came from.
See how teams shave days off every report.
Walk through a real Peekator dashboard with one of our researchers — live reporting, AI analysis, and editable .pptx generation on your own questions.